BI Dashboard - OKR & KPI Intelligence
Executive BI dashboard for tracking OKRs and KPIs across departments. Simulate connecting data sources, visualize business metrics, and ask an AI assistant about company performance.
Live Preview
Open in New TabBI Dashboard - OKR & KPI Intelligence
BI Dashboard is an executive-grade business intelligence tool for tracking Objectives & Key Results (OKRs) and Key Performance Indicators (KPIs) across departments. It simulates connecting to real data sources like Notion, Excel, and Jira, with an AI chat assistant for querying business metrics in natural language.
📊 Executive Dashboard
Department KPI Metrics
- 14 KPI cards across 4 departments (Engineering, Sales, Marketing, Customer Success)
- Trend indicators (up/down/flat) with percentage change badges
- Currency, percentage, and number formatting
- Data source indicator icons on connected metrics
OKR Progress Tracking
- 8 objectives with 22 key results across all departments
- Expandable cards showing individual key result progress
- Status badges: On Track (green), At Risk (amber), Behind (red)
- Department color coding for quick visual identification
- Progress bars with department-themed colors
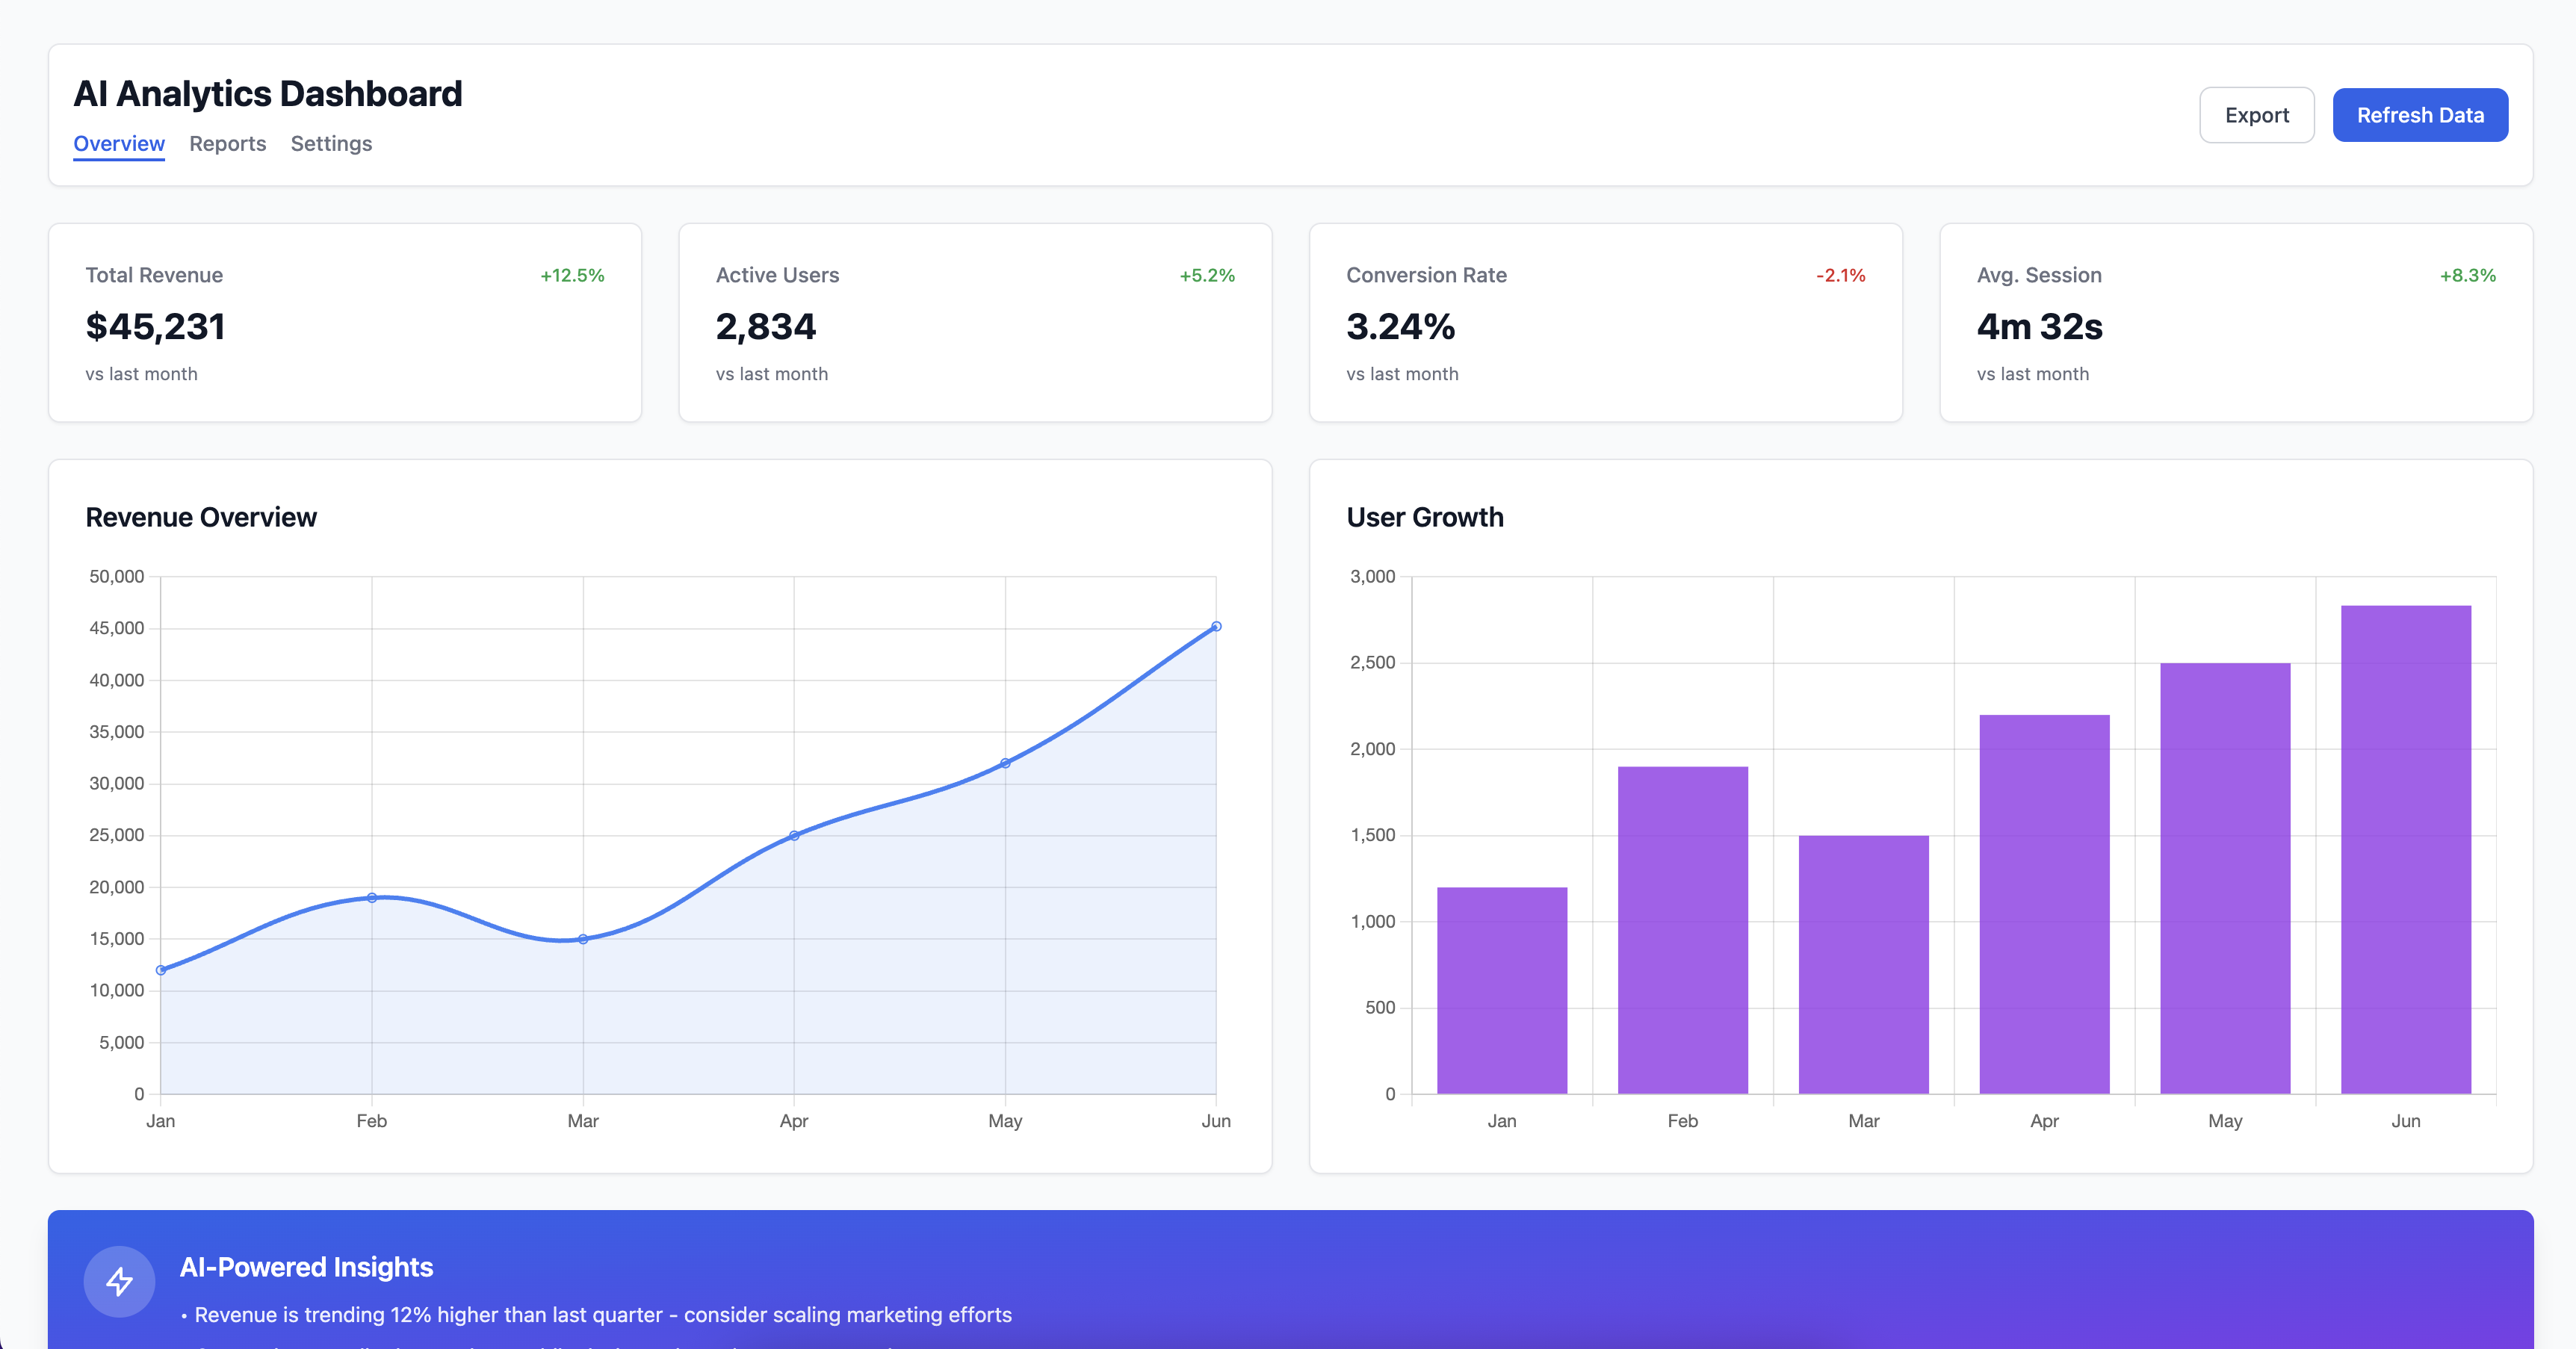
Interactive Charts
- Revenue Trend - 12-month area chart with gradient fill
- Sprint Velocity - Line chart tracking engineering throughput
- OKR Progress by Department - Horizontal bar chart comparison
- OKR Status Breakdown - Donut chart showing distribution
🔌 Simulated Data Connectors
Three Integration Types
- Notion - Sync OKRs, project boards, and documentation
- Excel / Google Sheets - Import financial data and forecasts
- Jira - Track engineering velocity and sprint progress
3-Step Setup Wizard
- Authenticate - Simulated OAuth connection flow
- Field Mapping - Toggle switches to map source fields to target fields
- Confirm - Review mapped fields and activate the connection
Connector Management
- Status badges (Not Connected / Connecting / Connected)
- Last sync timestamp display
- Mapped fields counter
- Connect/disconnect actions per connector
🤖 AI Chat Assistant
Natural Language Queries
Ask questions about your business metrics in plain English:
- "How are our Q1 OKRs progressing?"
- "What's our revenue forecast?"
- "Which team has the most blockers?"
- "Show me customer churn risk"
- "Compare department performance"
Smart Features
- Keyword-matching engine with 10 response templates
- Suggested follow-up questions after each response
- Typing indicator with animated dots
- Message history with clear chat option
- Slide-out drawer accessible from any page
- Floating chat bubble in bottom-right corner
🎯 Department Filtering
Color-Coded Filter Pills
- Filter all dashboard content by department
- Toggle between All, Engineering, Sales, Marketing, Customer Success
- Metrics, OKR cards, and charts update instantly
- Active filter highlighted with department's brand color
🏗️ Architecture
Navigation
- Fixed sidebar (desktop) with icon-based navigation
- Bottom navigation bar (mobile) for thumb-friendly access
- Two main views: Dashboard and Connectors
State Management
- Zustand stores for dashboard state, connector state, and chat state
- Deep-cloned connector data to prevent mutation issues
- Widget visibility toggles for dashboard customization
Design System
- Zinc palette - Clean, professional grayscale foundation
- Department colors - Blue (Engineering), Green (Sales), Amber (Marketing), Purple (Customer Success)
- shadcn/ui components - Button, Card, Badge, Progress, Dialog, Sheet, Tabs
- Tailwind CSS v4 with custom theme tokens
💡 Use Cases
For CEOs & Executives
- Get a bird's-eye view of company OKR progress
- Identify at-risk objectives before they become problems
- Ask natural language questions about business performance
- Filter by department to drill into specific team metrics
For VPs & Department Heads
- Track department-specific KPIs with trend analysis
- Monitor key result progress against quarterly targets
- Compare department performance via breakdown charts
- Connect team tools for automated data syncing
For Operations Teams
- Set up data connectors with intuitive field mapping
- Monitor which data sources are active and syncing
- Ensure consistent metric tracking across departments
- Generate insights from cross-functional data
🛠️ Technical Highlights
Modern Stack
- React 19 with hooks and functional components
- TypeScript for full type safety across 7 entity types
- Vite 6 for instant HMR and fast builds
- Tailwind CSS v4 with
@tailwindcss/viteplugin - Recharts for responsive, interactive visualizations
- Zustand for lightweight state management
- shadcn/ui (Radix primitives) for accessible components
Data Architecture
- Typed mock data constants with cross-referenced IDs
- Department → Objectives → Key Results hierarchy
- KPI metrics linked to data connectors
- Chat responses with metric references and follow-ups
Built with expertise by BinarCode - Your partner in building exceptional digital products.
Interested in a custom BI dashboard or OKR tracking tool? Let's talk about your project.
Key Features
- Executive OKR dashboard with real-time progress tracking
- Department-level KPI metrics with trend indicators
- Simulated data connectors (Notion, Excel, Jira)
- AI chat assistant for querying business metrics
- Interactive revenue and velocity trend charts
- OKR status breakdown with donut and bar visualizations
- Department filtering with color-coded pills
- 3-step connector setup wizard with field mapping
- Expandable objective cards with key results
- Responsive design with mobile bottom navigation
- Floating chat bubble with suggested questions
- Connect sources banner with dismissible prompt
Technologies Used
Related Projects
AI Powered Analytics Dashboard
Modern analytics dashboard with AI-powered insights, real-time data visualization, and customizable widgets for business intelligence.

TalentFlow Hiring Pipeline
Interactive hiring pipeline with Kanban board, drag-and-drop candidate management, AI scoring, and comprehensive candidate profiles. Fully functional recruitment tracking tool with 20 realistic candidates.
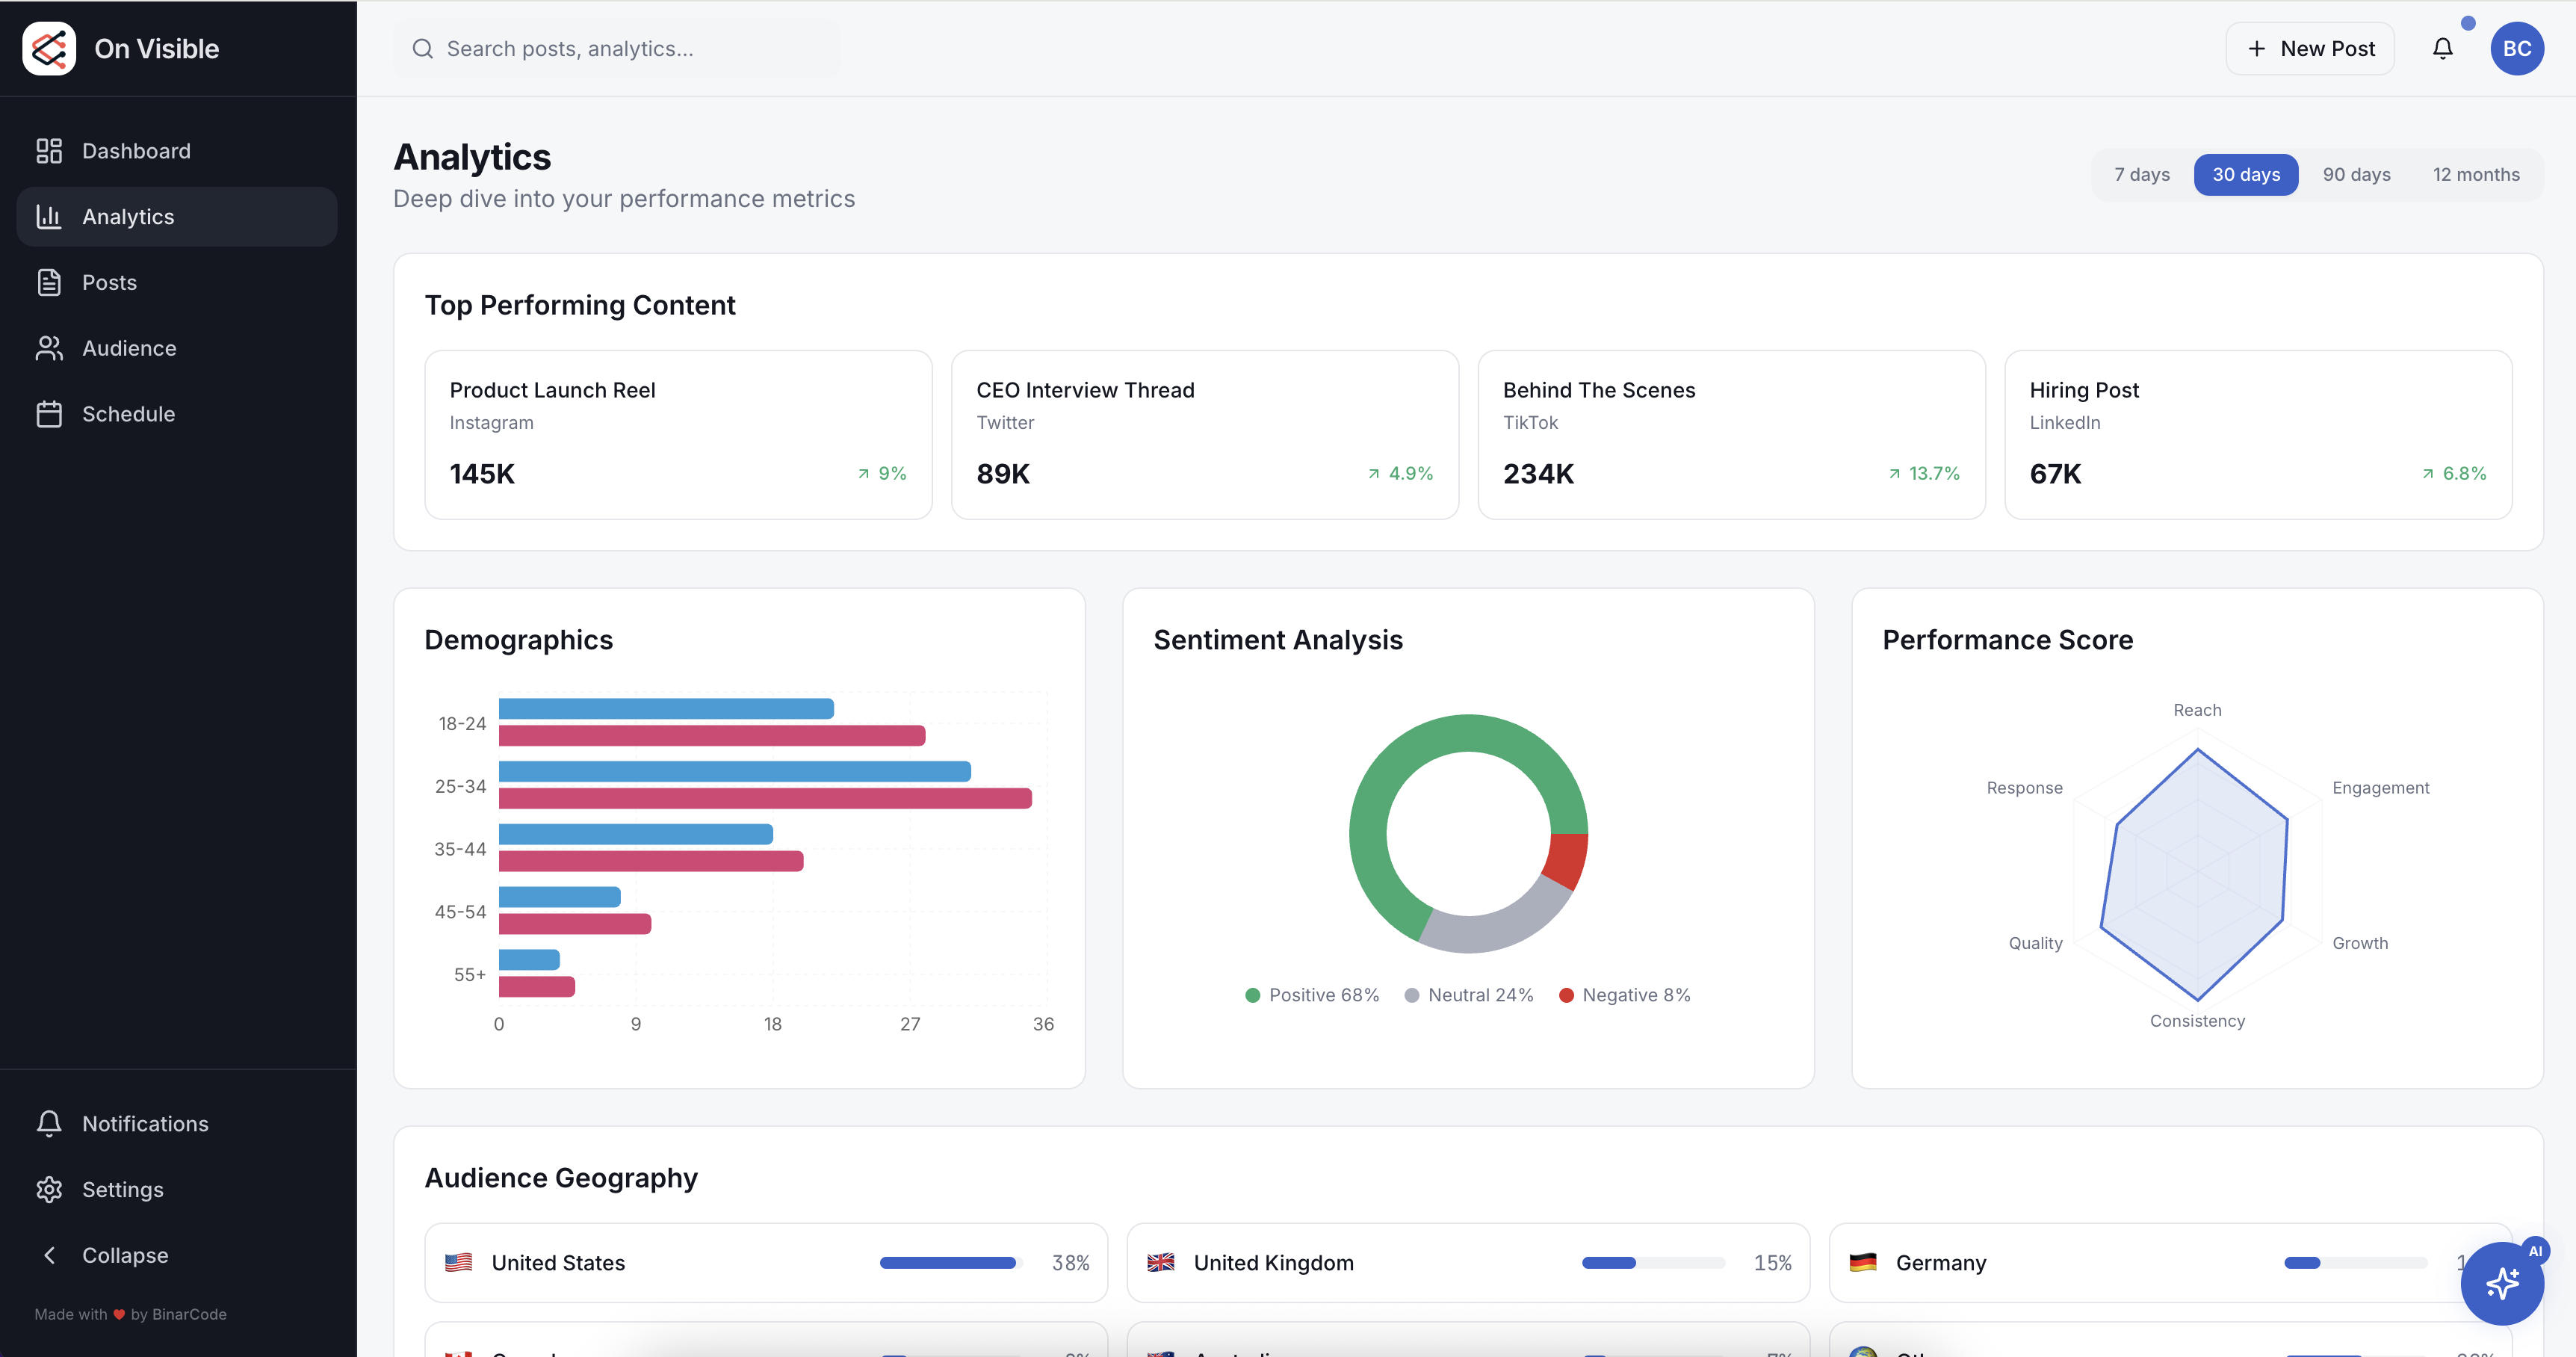
On Visible Online Presence Manager
Unified online presence manager for social analytics, content scheduling, and audience growth insights across platforms.