Runway - Financial Clarity Dashboard
Real-time cashflow & business metrics dashboard. Connect data sources, map fields semantically, and visualize everything live with customizable widgets and interactive analytics.
Live Preview
Open in New TabRunway - Financial Clarity Dashboard
Runway is a powerful, modern business metrics dashboard that transforms financial data into actionable insights. Built with a canvas-first approach, it lets you connect data sources, map fields semantically, and visualize your business health in real-time with customizable widgets.
🔌 Flexible Data Integration
Multiple Connection Types
- MCP Protocol Support - Native Model Context Protocol connectors for seamless integrations
- API Connections - REST API integrations with custom endpoints
- Google Sheets - Direct spreadsheet data import
- Manual Upload - CSV/JSON file uploads for quick data visualization
Universal Field Mapping
Semantic mapping interface that works with any data source. Simply tell Runway what represents "revenue," "expense," "date," etc., and it handles the rest. No rigid schema requirements.
Connection Management
- Add, edit, and remove data sources on the fly
- Monitor connection health (connected/pending/disconnected)
- View field mapping status per connector
- Quick access to mapping panel from sidebar
📊 Customizable Widget Canvas
Build your perfect dashboard by adding and arranging widgets:
Metric Widgets
- Cash Balance - Current financial position with trend indicators
- Revenue - Monthly income tracking with growth percentage
- Burn Rate - Monthly expense monitoring
- Net Profit - Revenue minus costs calculation
- MRR - Monthly recurring revenue tracking
- Runway - Months of cash remaining projection
Chart Visualizations
- Cashflow Chart - Income vs Costs over time with interactive tooltips and gradient fills
- Revenue Breakdown - Pie chart visualization by category or source
- Goal Tracker - Visual progress bars toward financial targets
List Views
- Transactions List - Recent activity feed with filtering and search
- Goals Dashboard - Track multiple objectives with progress indicators
Canvas Features
- Add widgets via "+" button or command palette
- Remove widgets individually
- Auto-arranging responsive grid
- Full-width charts for detailed analysis
- Widget count indicator in header
⚡ Real-time Features
Live Data Sync
- Auto-refresh at configurable intervals (30s, 1m, 5m)
- Manual refresh with ⌘R keyboard shortcut
- Instant updates across all widgets when data changes
- Last sync indicator shows exact time of last update
Connection Status
- Real-time monitoring of all data source health
- Visual indicators for connection state
- Pending/connected/disconnected status badges
- Quick troubleshooting from connector panel
🎨 User Experience
Command Palette
Press ⌘K to access quick actions:
- Add new widgets
- Connect data sources
- Refresh data
- Open settings
- Navigate features instantly
Keyboard Shortcuts
Power user productivity features:
⌘/Ctrl + K- Command palette⌘/Ctrl + B- Toggle sidebar⌘/Ctrl + W- Add widget⌘/Ctrl + N- Add data source⌘/Ctrl + R- Refresh data⌘/Ctrl + ,- Settings?- Show shortcutsEsc- Close modals
Interface Features
- Named Dashboards - Create and switch between multiple views
- Editable Dashboard Names - Click to rename your workspace
- Drag & Drop - File upload via drag and drop zones
- Responsive Design - Works beautifully on desktop, tablet, mobile
- Dark Mode - Modern, eye-friendly interface
- Help Modal - Built-in documentation and guides
- Compact Mode - Dense layout option for more data on screen
⚙️ Settings & Configuration
Dashboard Settings
- Refresh Intervals - Set auto-refresh frequency or manual only
- Animation Controls - Toggle animations on/off for performance
- Compact Mode - Enable dense layout for more widgets
- Notifications - Configure alerts and update preferences
Data Management
- Field Mapping Panel - Visual interface for semantic mapping
- Data Preview - View raw data before visualization
- Data Validation - Ensure data quality before sync
- Export Capabilities - Download data and reports
💡 Use Cases
For Startups
- Monitor runway and burn rate in real-time
- Track MRR growth and revenue milestones
- Visualize cashflow to plan fundraising
- Set and track financial goals
For Finance Teams
- Centralize data from multiple sources
- Create custom dashboards for stakeholders
- Generate reports with up-to-date metrics
- Monitor budget adherence
For Business Owners
- Get instant overview of business health
- Track KPIs visually without spreadsheets
- Make data-driven decisions faster
- Share dashboards with team members
For Agencies
- Monitor client project profitability
- Track multiple revenue streams
- Analyze expense patterns across projects
- Report client metrics in real-time
🛠️ Technical Highlights
Architecture
- Component-based - Reusable, maintainable React components
- Type-safe - Full TypeScript coverage for reliability
- State management - Zustand for predictable state updates
- Performance optimized - Lazy loading and code splitting
Data Flow
- Connect - Add data source (MCP, API, Sheets, or File)
- Map - Semantic field mapping in dedicated panel
- Visualize - Auto-populate widgets with mapped data
- Analyze - Interactive charts and real-time metrics
- Refresh - Automatic or manual data sync
Modern Stack
- React with modern hooks and patterns
- TypeScript for type safety
- Vite for lightning-fast builds
- shadcn/ui for high-quality components
- Tailwind CSS for utility-first styling
- Recharts for powerful data visualization
- Zustand for simple state management
🎯 Key Concepts
Canvas-First Approach
Unlike rigid dashboards, Runway lets you build your ideal view by adding and arranging widgets as needed. Start with an empty canvas and add only the metrics that matter to you.
Semantic Mapping
Connect any data source by mapping fields semantically - no need to match exact column names or schemas. The system adapts to your data structure.
Real-time Everything
Data flows continuously from your sources to your dashboard, ensuring you always have the latest information without manual intervention.
📱 Responsive Design
Runway adapts seamlessly to any screen size:
- Desktop (1024px+) - Full-featured experience with sidebar and all widgets
- Tablet (768px-1023px) - Touch-optimized controls with responsive grid
- Mobile (<768px) - Streamlined interface with essential metrics, collapsible sidebar
All charts and widgets reflow beautifully to fit available space while maintaining interactivity.
🌟 Demo Mode
Runway includes realistic demo data to showcase all features:
- Pre-populated metrics with trending indicators
- Sample cashflow data across 6 months
- Revenue breakdown by category
- Recent transaction history
- Goal tracking examples
Perfect for exploring the interface before connecting real data sources.
🚀 Business Value
Runway demonstrates how modern data visualization can:
- Reduce decision time - Instant access to key metrics
- Improve transparency - Real-time data for all stakeholders
- Save time - No more manual report generation
- Enable insights - Interactive charts reveal trends
- Scale easily - Add sources and widgets as you grow
Built with expertise by BinarCode - Your partner in building exceptional digital products.
Ready to transform your business metrics? Let's talk about custom dashboards and data integrations.
Key Features
- MCP Protocol support for native integrations
- Flexible data source connections (API, Sheets, CSV/JSON)
- Semantic field mapping interface
- Customizable widget canvas with drag & drop
- Real-time data sync with configurable intervals
- Interactive cashflow charts and visualizations
- Revenue breakdown by category
- Transaction history with filtering
- Goal tracking dashboard
- Command palette (⌘K) for quick actions
- Comprehensive keyboard shortcuts
- Named dashboard support
- Dark mode interface
- Mobile-responsive design
- Connection health monitoring
Technologies Used
Related Projects
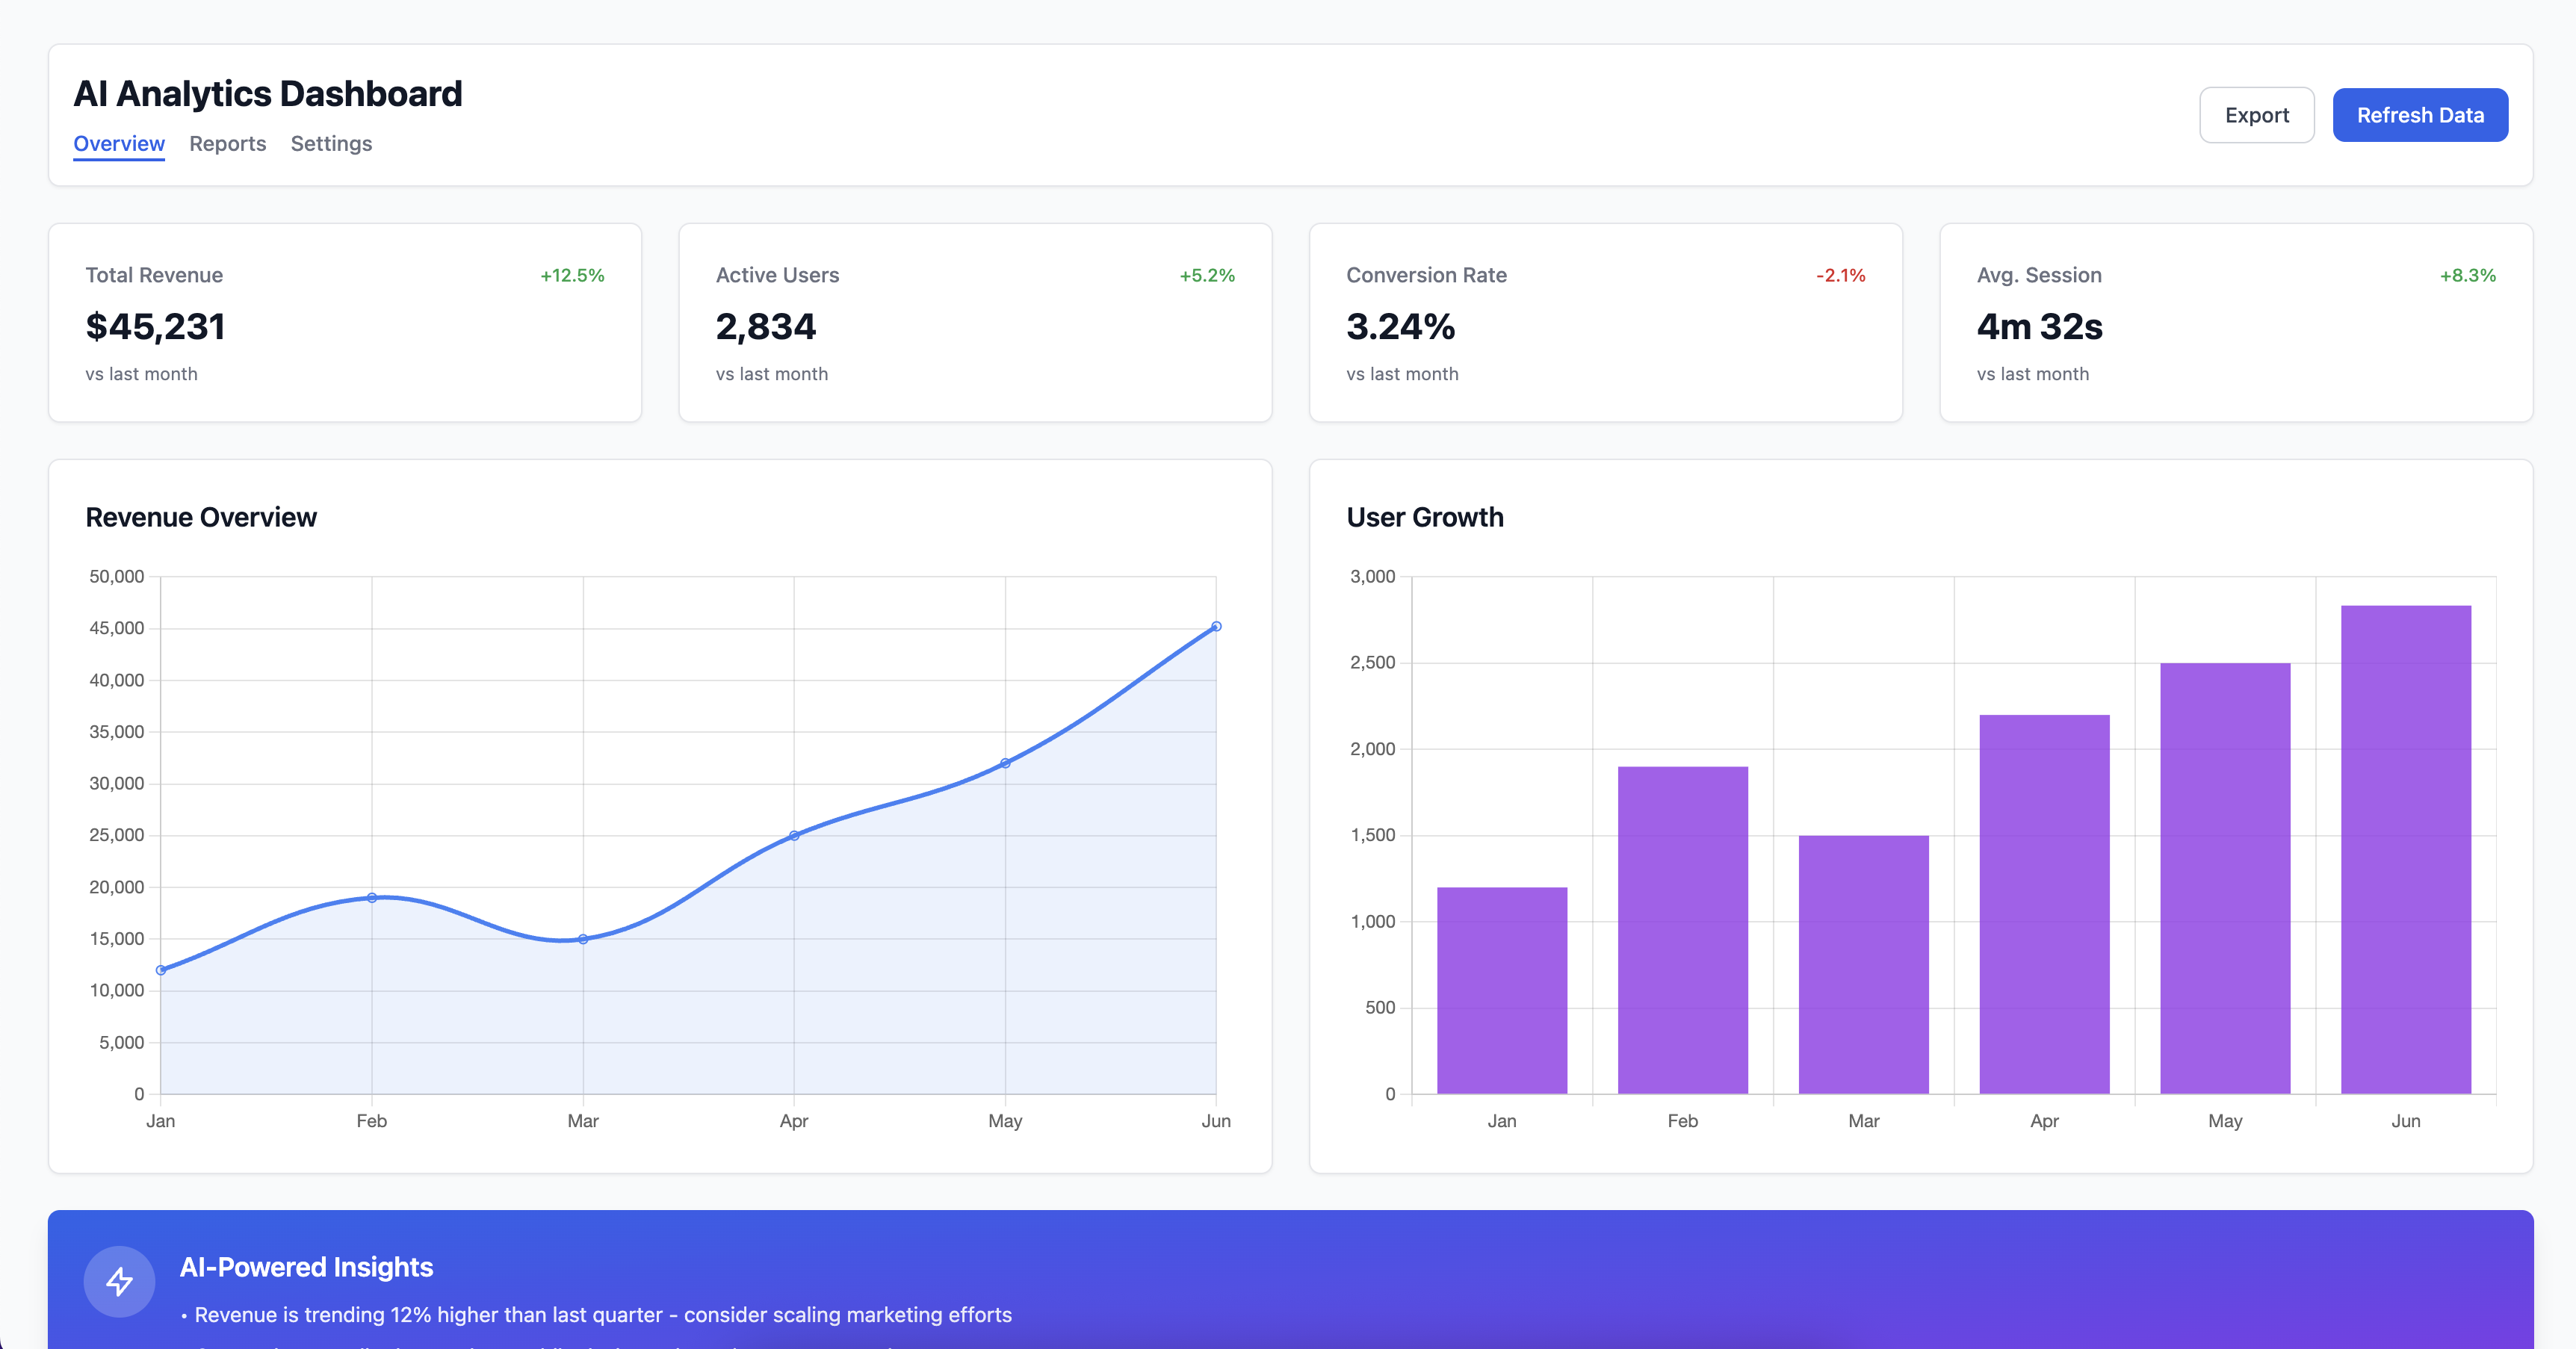
AI Powered Analytics Dashboard
Modern analytics dashboard with AI-powered insights, real-time data visualization, and customizable widgets for business intelligence.
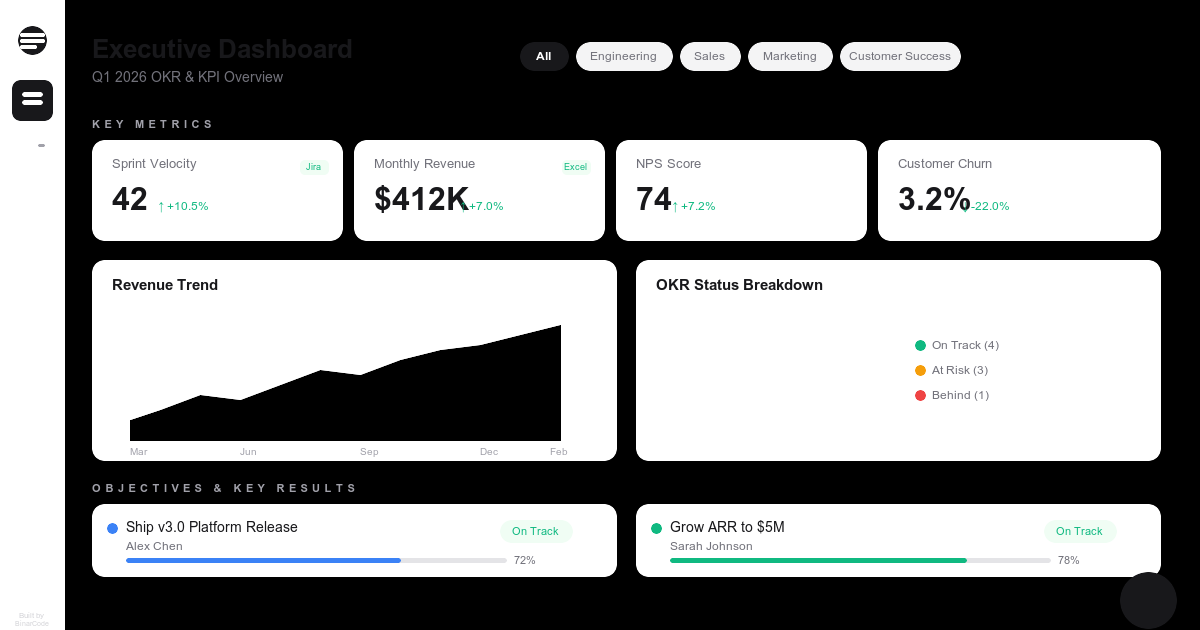
BI Dashboard OKR KPI Intelligence
Executive BI dashboard for tracking OKRs and KPIs across departments. Simulate connecting data sources, visualize business metrics, and ask an AI assistant about company performance.

TalentFlow Hiring Pipeline
Interactive hiring pipeline with Kanban board, drag-and-drop candidate management, AI scoring, and comprehensive candidate profiles. Fully functional recruitment tracking tool with 20 realistic candidates.